
05 · Where are the levels that matter?
Professional charts
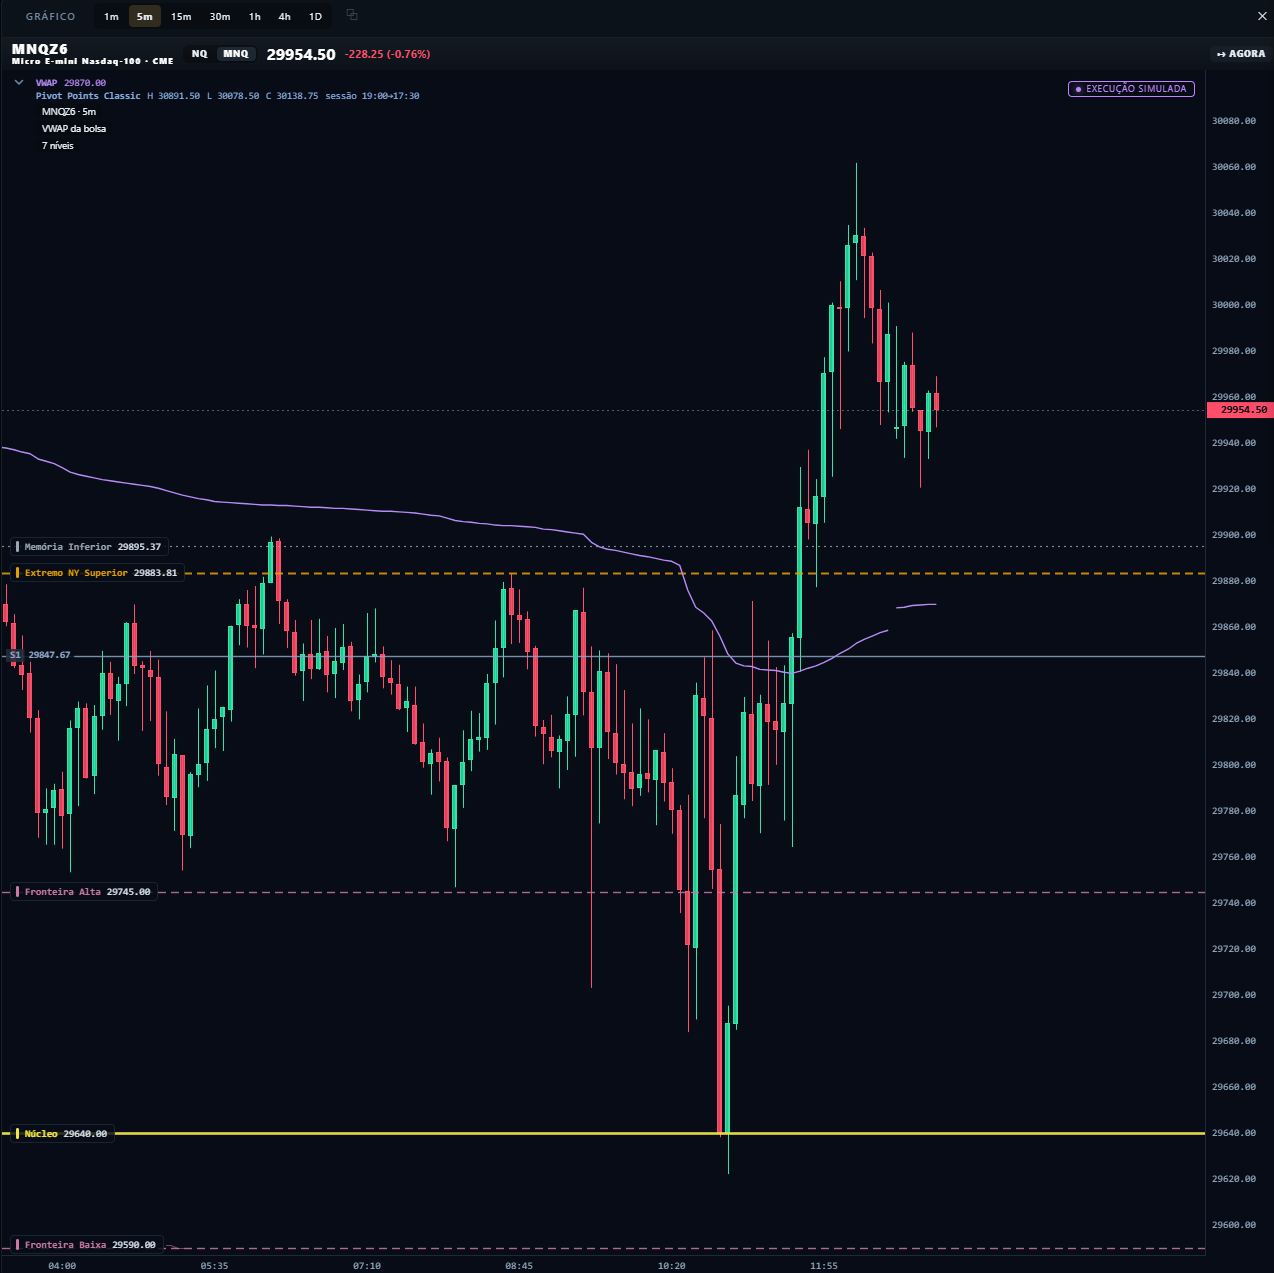
Candles, multiple moving averages, Bollinger, VWAP, volume profile, POC, VAH, VAL and pivots in a native chart.
Current stage
AvailableThe Miura chart is not an add-on: it is where the reading meets structure. The levels the other tools reference — VWAP, POC, VAH, VAL, pivots, session highs and lows — are drawn in the same place where you follow price.
The technical layer is conventional on purpose. The edge is not in inventing a new indicator, but in keeping the chart consistent with what flow and context are saying.
What this tool shows
- Candles across multiple time windows
- Multiple moving averages and Bollinger bands
- VWAP and deviations
- Volume profile with POC, VAH and VAL
- Classic pivots and session extremes
Related tools
01
Market Overview
What is today’s context?
02Market Control
Who is in control?
03Pulse
Who is in charge right now — and how strongly?
Each tool is one piece.
The value shows up when they are read together.