
06 · Where is the liquidity?
DOM and Heatmap
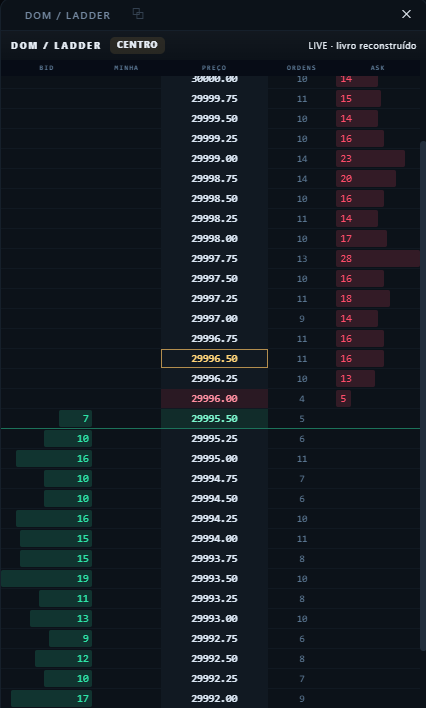
Visualisation of the order book and the liquidity available around price.
Current stage
In developmentThe book shows what is resting and waiting; flow shows what is crossing. Miura’s DOM presents depth around price along with connection state — including when the market is closed or the book is reconstructed, so no screen implies data that does not exist at that moment.
The liquidity heatmap, which accumulates that book over time, is in development.
What this tool shows
- Bid and ask depth around price
- Working orders and connection state
- Explicit signalling of a closed market or reconstructed book
- Accumulated liquidity heatmap (in development)
Related tools
01
Market Overview
What is today’s context?
02Market Control
Who is in control?
03Pulse
Who is in charge right now — and how strongly?
Each tool is one piece.
The value shows up when they are read together.